SonarQube is an open-source project by SonarSource, and it supports Java, C#, JavaScript, Python, PHP, and more for free. Other legacy languages like COBOL are available for purchase. You can play around with SonarQube's public analysis of various open source projects (like Facebook's React project) to get a feel for what it offers.
While SonarQube's documentation is great, it can be a bit hard to put together an end-to-end setup. In this post, we'll cover how we configured SonarQube for one of our C# projects here at Jetabroad.
The End Goal
First, this was our previous way of developing: a standard pull request setup using GitHub:
We integrated SonarQube with our continuous integration system, TeamCity:

By integrating with TeamCity, we can run SonarQube quickly on every pull request (about 15 seconds), as well as a daily full run that analyzes the entire repository (about 5 minutes for a couple hundred thousand lines of C#). We hooked SonarQube into our beloved bot Jetabot, who leaves review comments on the pull requests:
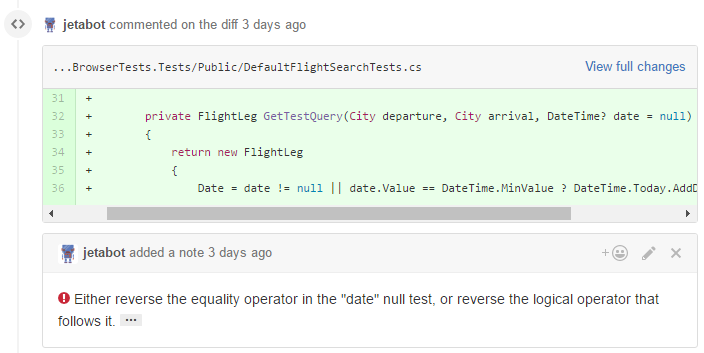
As you can see above, SonarQube detected a boolean logic error in this pull request, which will lead to a
NullReferenceException if the date parameter is null. If you were to click the ellipsis symbol at the end of the comment, SonarQube would display a page explaining the issue in more detail.Setup Instructions
As a prerequisite, this post assumes that you've already configured TeamCity to build your GitHub Pull Requests. If you haven't done that yet, take a look at this blog post from the creators of TeamCity.Installation of SonarQube is easy and well-documented. We installed it on our TeamCity build server, running on an alternate port. After installing it, we added the following plugins using the SonarQube web interface:
- C# - Enables scanning of C# source files
- JavaScript - Enables scanning of JavaScript source files
- Generic Coverage - Imports code coverage reports defined a given format
- Git - Git SCM Provider
- GitHub - Pushes preview analysis results as pull request comments on GitHub
- LDAP - Delegates authentication to LDAP
Once you get it set up, you need to integrate it into your build process. The first thing we'll set up is the daily analysis job. Here are the changes we needed to make
- If you don't already have a daily analysis job in TeamCity, create a new TeamCity build configuration in your existing TeamCity project. This new build configuration should do all the typical checkout / build / code coverage steps, but we'll configure it to do a full SonarQube analysis as well. Add a Trigger that runs the build daily.
- Change the code coverage step to output an HTML report, which can be imported using the "Generic Coverage" plugin in SonarQube. How you do this is up to your specific code coverage and unit test configuration. We use a PowerShell script to start dotCover with NUnit. You'll probably have more advanced configuration for your code coverage tool (e.g. files and attributes to ignore); but below is a bare-bones example. The important part is that the output is a CoverageReport.html file:
& 'C:\TeamCity\buildAgent\tools\dotCover\dotCover.exe' analyse `
/TargetExecutable="\path\to\nunit-console.exe" `
/TargetArguments="a.tests.dll b.tests.dll c.tests.dll" `
/ReportType="HTML" `
/Output="CoverageReport.html" `
/TargetWorkingDir="%teamcity.build.checkoutDir%"
- Follow the installation instructions for the plugin, up to the "Configuring SonarQube Build Step" section.
- In the above instructions, when you add the new "SonarQube Runner" TeamCity build step, use the following settings:
- Project Name: %system.teamcity.projectName%
- Project Key: %teamcity.project.id%
- Optionally, set "Project Version" to a meaningful number. We set it to the first 8 characters of our git revision hash.
- Additional Parameters (under Advanced Options): The "publish" mode means full solution analysis.
-Dsonar.language=cs
-Dsonar.analysis.mode=publish
-Dsonar.cs.dotcover.reportsPaths=CoverageReport.html
At this point, we should have a full working project analysis! Run the TeamCity build and verify that you get results in SonarQube.
GitHub Pull Request Monitoring
Next, let's set up the GitHub Pull Request configuration.
- Determine what GitHub account you want to use for the automatic Pull Request comments. Create a Personal Access Token using that account. Give the token "repo" permissions, and give the user write permissions to the repository that contains the pull requests, so the bot can leave comments on the Pull Requests.
- These account permissions are a little bit broad, but unfortunately GitHub doesn't have the fine-grained permissions required to lock this down more.
- In SonarQube, add the generated Personal Access Token as the SonarQube "sonar.github.oauth" property. There are multiple ways to do this; we chose to enter the token into the dbo.properties table in SonarQube's database.
- The fully qualified repository name, of the form "Organization/RepoName"
- The pull request number
param(
    [Parameter(Mandatory=$true)]
    [string] $branch,
    [Parameter(Mandatory=$true)]
    [string] $project
)
# This sets variables that tell SonarQube what GitHub PR to analyze.
# It is called by the "Set SonarQube Configuration" TeamCity build step.
try {
  # try to convert the branch name to a PR number. So the branch "54/merge" becomes 54.
  # If the logic fails, the variables are set to empty string, and SonarQube's GitHub
  # plugin won't run. For the case where the branch isn't a PR (e.g. develop), we don't
  # want the GitHub plugin to run, so failure is expected and ignored.
  $pullRequest = $branch.Replace("/merge", "")
  $pullRequest = [convert]::ToInt32($pullRequest, 10) # it's ok if line fails
  $pullRequestParam = "-Dsonar.github.pullRequest=$pullRequest"
  $repositoryParam = "-Dsonar.github.repository=Jetabroad/$project"
}
catch {
}

"##teamcity[setParameter name='sonar.github.pullRequest' value='$pullRequestParam']"
"##teamcity[setParameter name='sonar.github.repository' value='$repositoryParam']"
The magic "##teamcity" lines are special instructions to TeamCity. This script is then called in a build step like this:
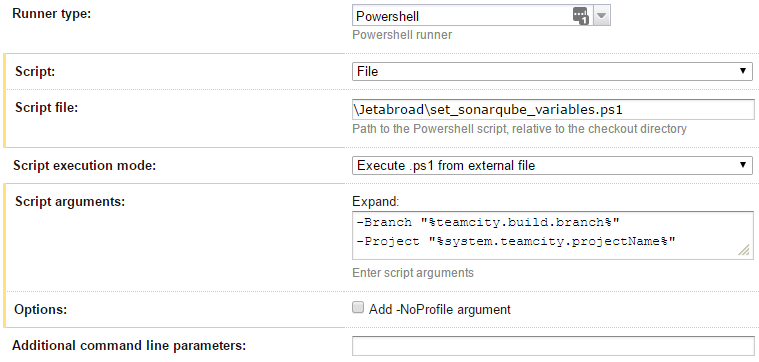
Finally, now that we have the required variables, we can add a "SonarQube Runner" build step that starts the SonarQube analysis. Here are the required settings:
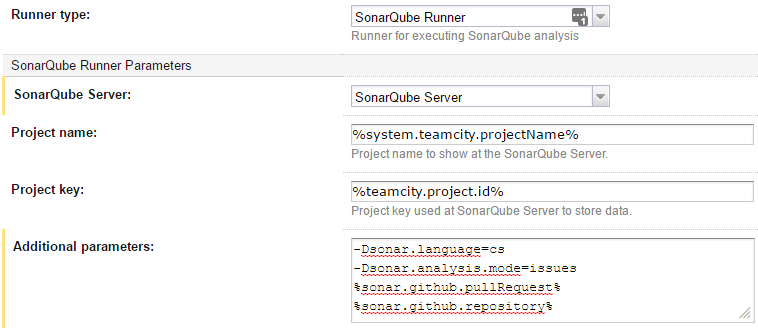
The "-Dsonar.analysis.mode=issues" tells SonarQube to do a "quick scan" rather than a full project scan. As a side note, since we're referencing custom variables, we'll need to default the custom variables to something in the "Parameters" section of the build configuration. Otherwise, TeamCity won't run our build on any agents, since it doesn't know if the agents will be able to define those variables:

Now, open a buggy pull request to test this out! TeamCity will detect the Pull Request and launch SonarQube. SonarQube will analyze the project, and post Pull Request comments identifying the issues. If it doesn't work, you can add -X and -e to the "Additional Parameters" section to get debug output in the TeamCity build log.
Custom SonarQube rules: If you attended our previous .NET Meetup, you'll know all about Roslyn Analyzers. You can use Roslyn Analyzers to add your own custom "code smell" detectors to SonarQube.
Install the SonarLint Visual Studio extension: It's a poor developer experience when he or she is surprised by the automated review comments. Developers can install SonarLint in Visual Studio to get the same checks that SonarQube has. It can even connect to your SonarQube server and use the same rule configuration!
We're done! Now we've configured SonarQube to help us keep our code in shape. We get daily full codebase scans, as well as scans for every GitHub pull request. Happy hacking!
Optional Configuration
There are a few last things you might want to configure:- Files and patterns to ignore: Under "Administration → Analysis Scope", you'll want to exclude various files from analysis. For example, you may want to exclude issues in files that contain the string "GeneratedCodeAttribute".
- LDAP / Active Directory integration: SonarQube maintains its own store of users and groups. At Jetabroad, we wanted to offload this to Active Directory instead. After installing the LDAP plugin, add the following properties to sonarqube/conf/sonar.properties file and restart the service:
  sonar.security.realm=LDAP
  ldap.realm=corp.mycompany.com
  ldap.url=ldap://domaincontroller.corp.mycompany.com:389
  ldap.bindDn=service-user@corp.mycompany.com
  ldap.bindPassword=service-user-password
  ldap.user.baseDn=CN=Users,DC=corp,DC=mycompany,DC=com
  ldap.user.request=(&(objectClass=user)(sAMAccountName={login}))
  sonar.security.localUsers=admin
- This last line, "localUsers" will make the "admin" account a local user rather than an LDAP user. This way, if you accidentally lock yourself out, you can still use the "admin" user to access SonarQube.